
Store diagnosis
La Carnicería Virtual
I reviewed an online butcher shop top to bottom to find why people came in and did not buy. I delivered a list of fixes ordered by how much each one helps sales.
- Work for a brand
- type of project
- Shopify · Liquid
- main tools
- 3
- real screenshots of the project
01 · The challenge
What was going on
Context
La Carnicería Virtual had a large catalog and a good offer. What was failing was elsewhere: the site loaded slowly, finding the cut you wanted was hard, and it lacked the signals that make you comfortable buying meat online.
The problem
Say what to fix first without proposing a redesign nobody asked for, and without mistaking an ugly-looking technical number for something actually costing sales.
My part
I reviewed the experience, the speed, Google search, the measurement, and how the store is put together, and turned it into an ordered list of work.
02 · How I solved it
How I decided to solve it
- 01
Walk the store the way a customer would: homepage, category, product, and cart, skipping no steps.
- 02
Compare what you can see with what the tools measure and with how the site is built underneath.
- 03
Rank every finding by how much it moves sales, how much it costs to fix, and who it depends on.
03 · What I made
What got built
- A map of everything I found, by area.
- Each item scored: how much it adds and how much it costs.
- A 30, 60, and 90-day plan: the cheap and fast things first, the deeper ones after.
04 · Charts
The numbers as charts
LCV-PRI
Published finding priority
Distribution of annotations shown in this case, not the full audit inventory.
LCV-LCP
Mobile LCP: field vs lab
Keeping CrUX and Lighthouse separate avoids treating lab as a field substitute.
- 3.6sCrUX (field)May 19–June 15, 2026.
- 16sLighthouse (lab)Lab condition on June 16, 2026.
LCV-RDM
30 / 60 / 90 roadmap
Work sequence proposed from impact and effort.
05 · The product
Explore the project
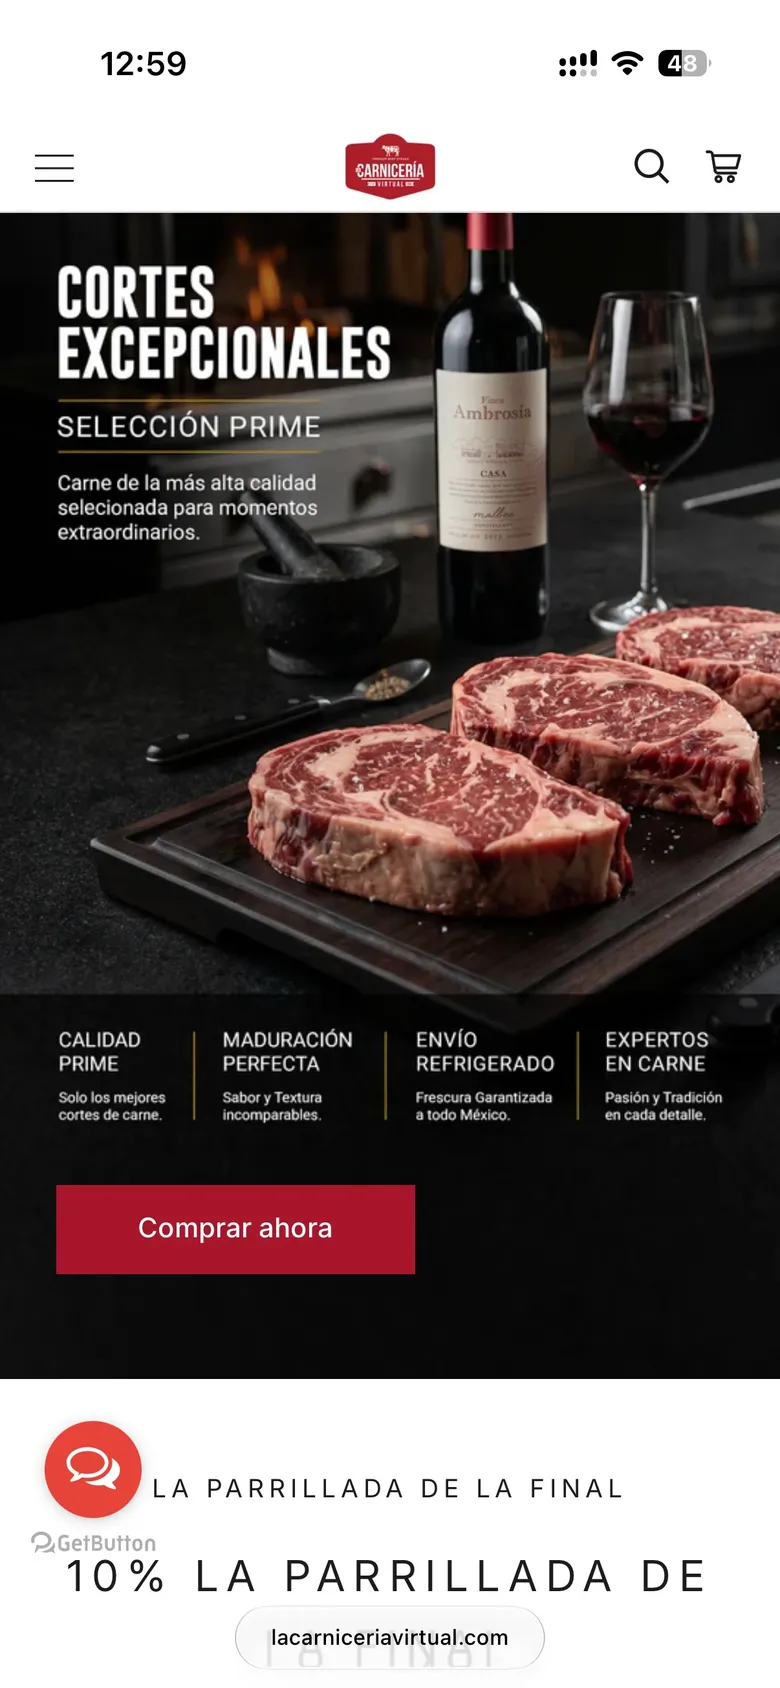
01 How the store opened in July 2026, when I ran the analysis: the promise in four pillars — quality, aging, refrigerated delivery, and people who know meat. The site has changed its hero since.
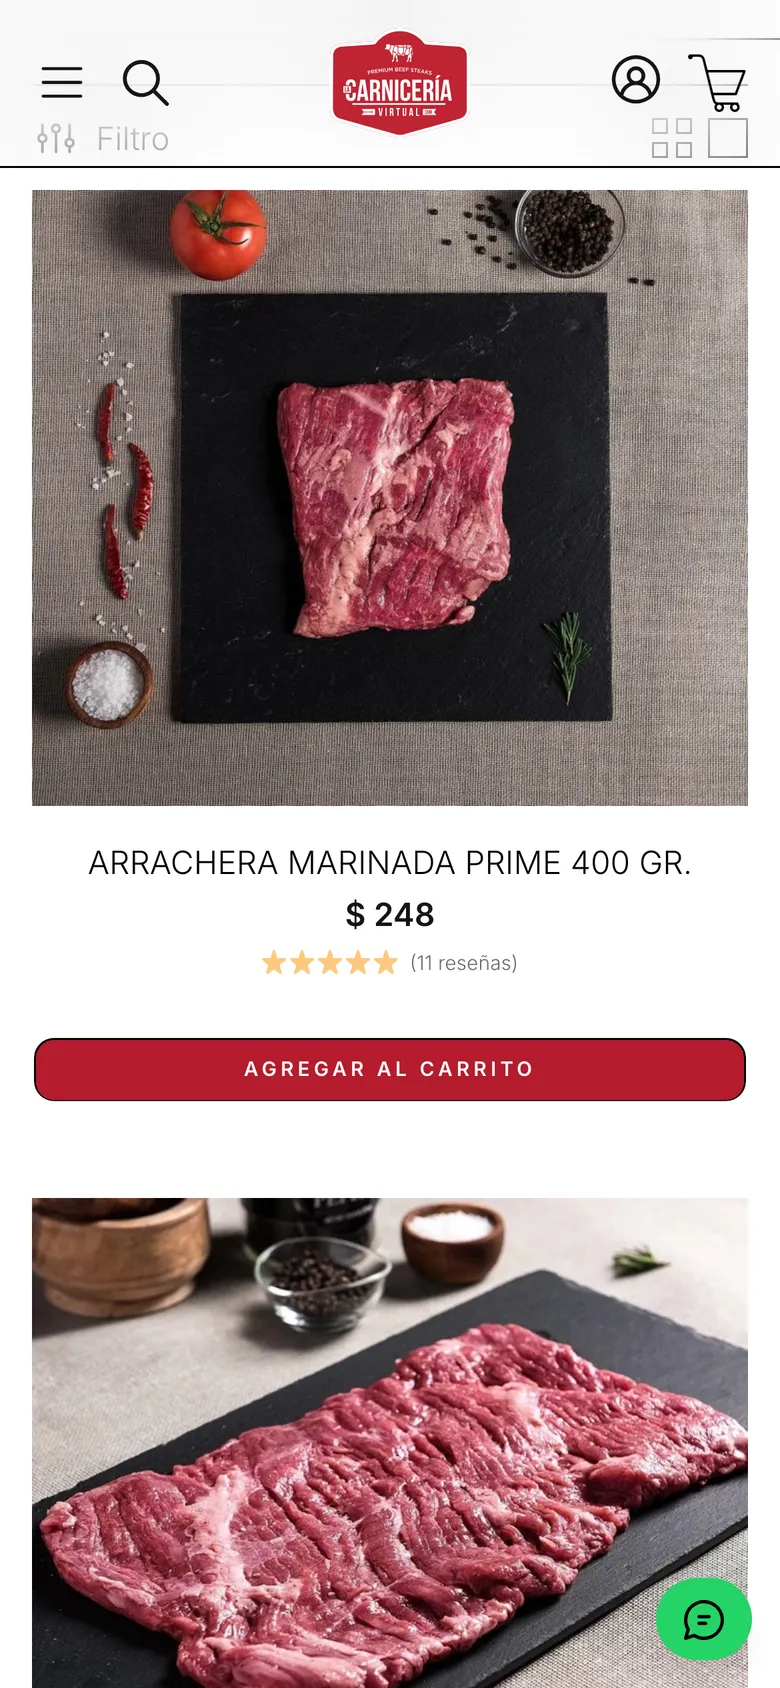
02 Simple discovery: a product grid with visible pricing and a global CTA.
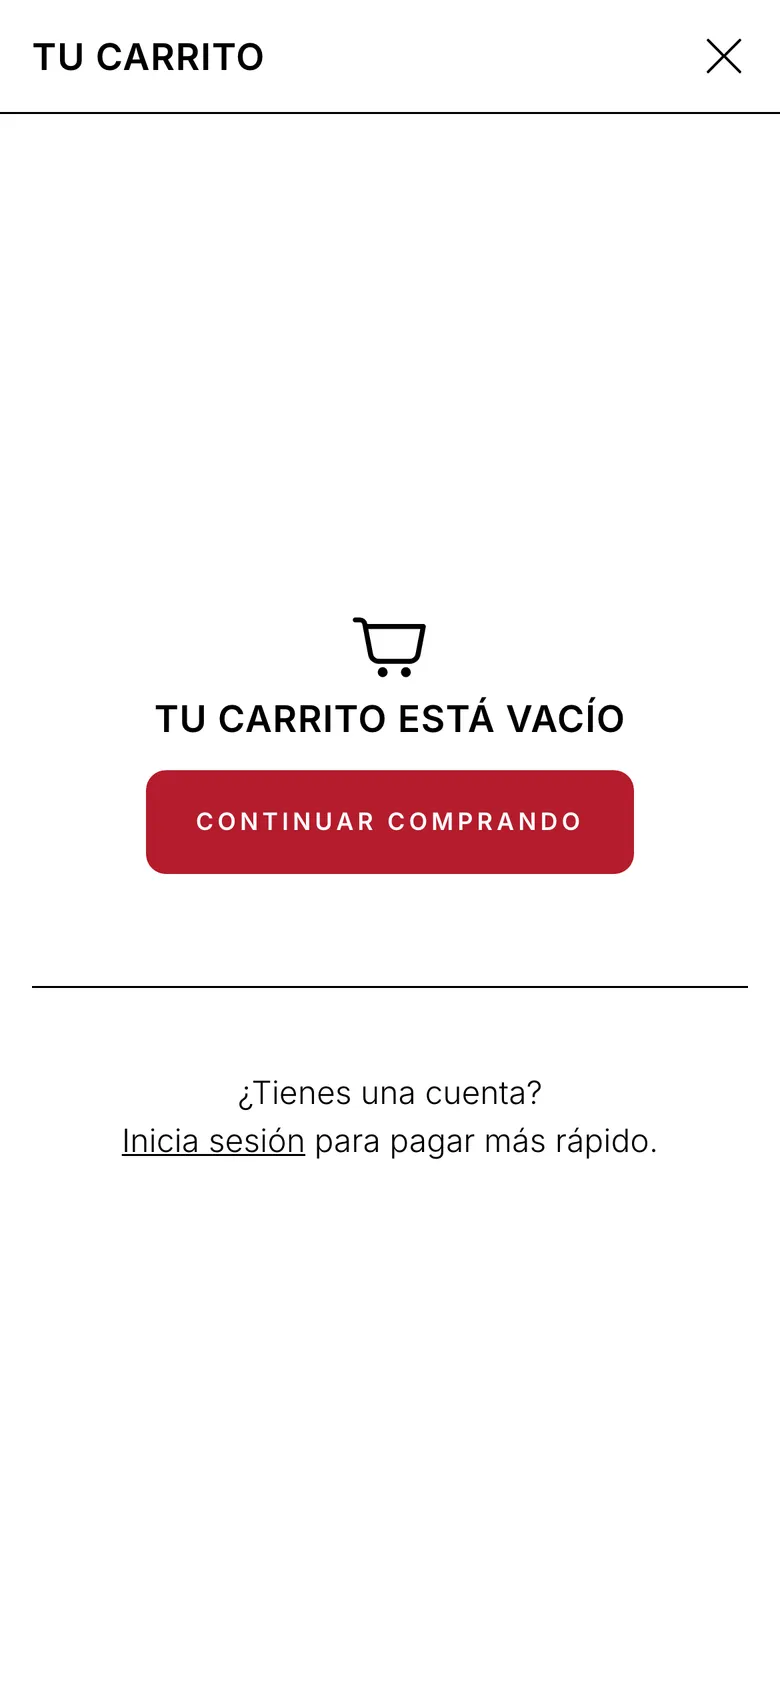
03 The drawer works the ticket: free-shipping progress plus instant cross-sell.
06 · How it turned out
What changed in the end
A concrete plan on three fronts: load fast on a phone, make products findable, and make paying feel safe.
The team ended up with a clear order instead of a pile of loose problems.
What I would not compromise on
- Understand first, redesign after.
- A technical number only matters if it costs the business money.
- An analysis that does not end in decisions is useless.
07 · Technology
What it is made with
- ShopifyShopify
- ShopifyLiquid
- ChromeChrome DevTools
- PageSpeed InsightsPageSpeed Insights
- ChromeChrome UX Report
- ChromeLighthouse
- Google Analytics 4GA4
- Google Tag ManagerGTM
- Meta AdsMeta Ads
- Google AdsGoogle Ads


More cases
Other projects you can review
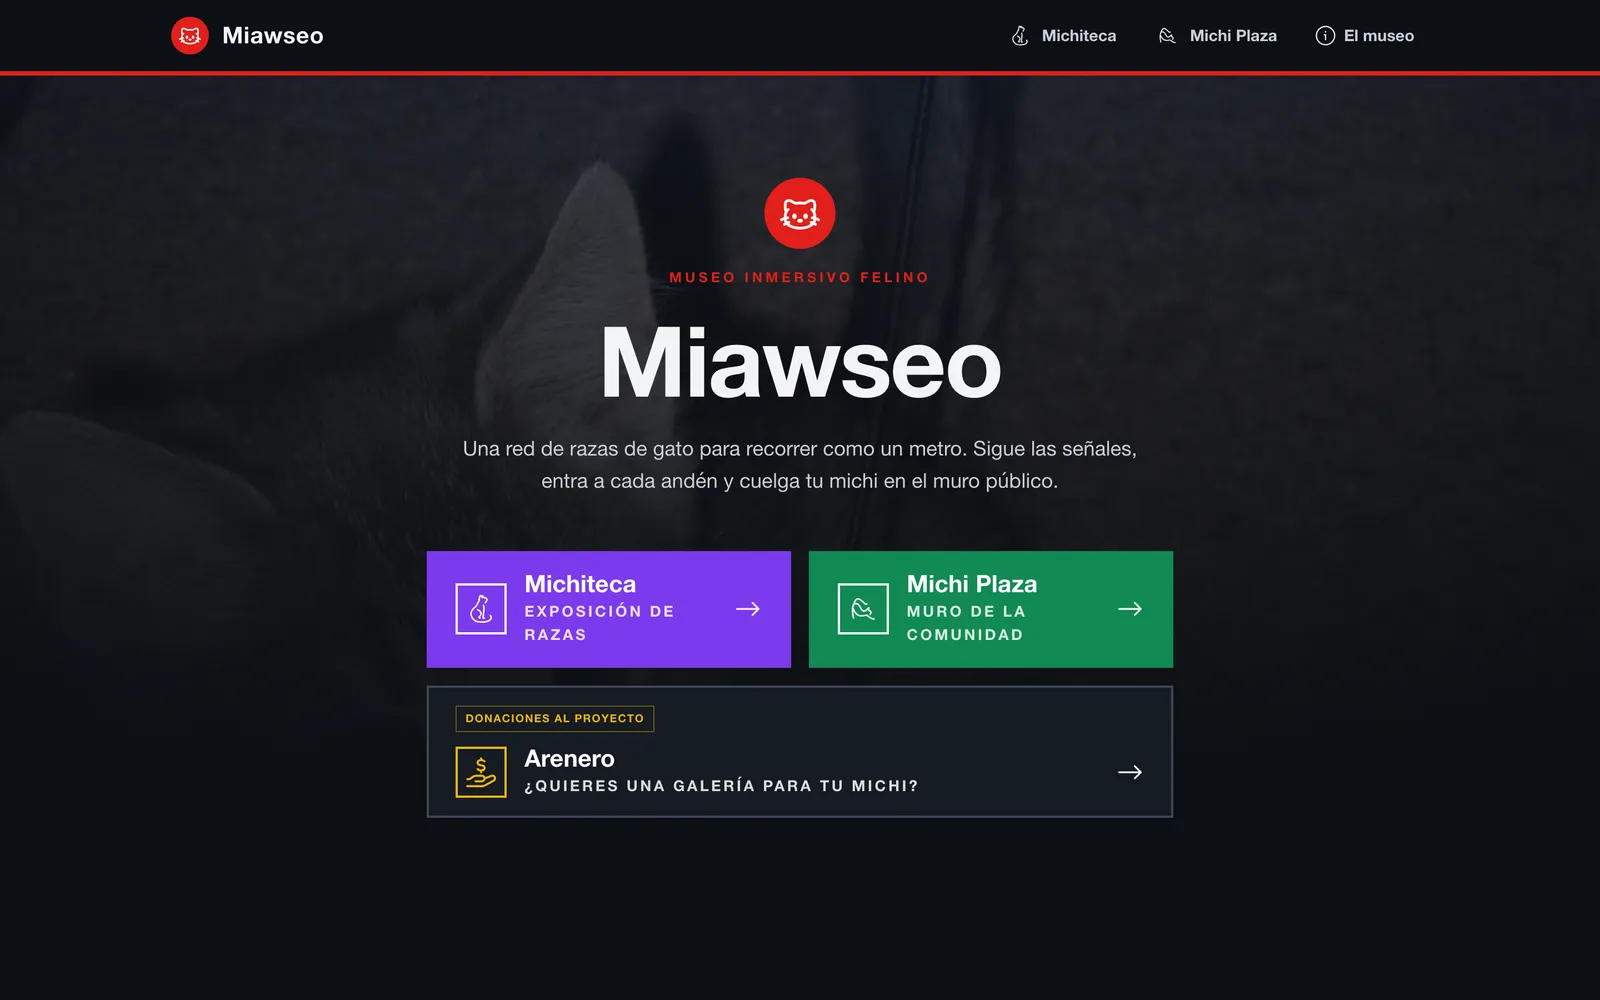 MIAWSEO — MichitecaA site about cat breeds where you move around like on a metro: lines, stations, and routes. People can contribute, but nothing publishes without review. I designed and coded all of it.See the case
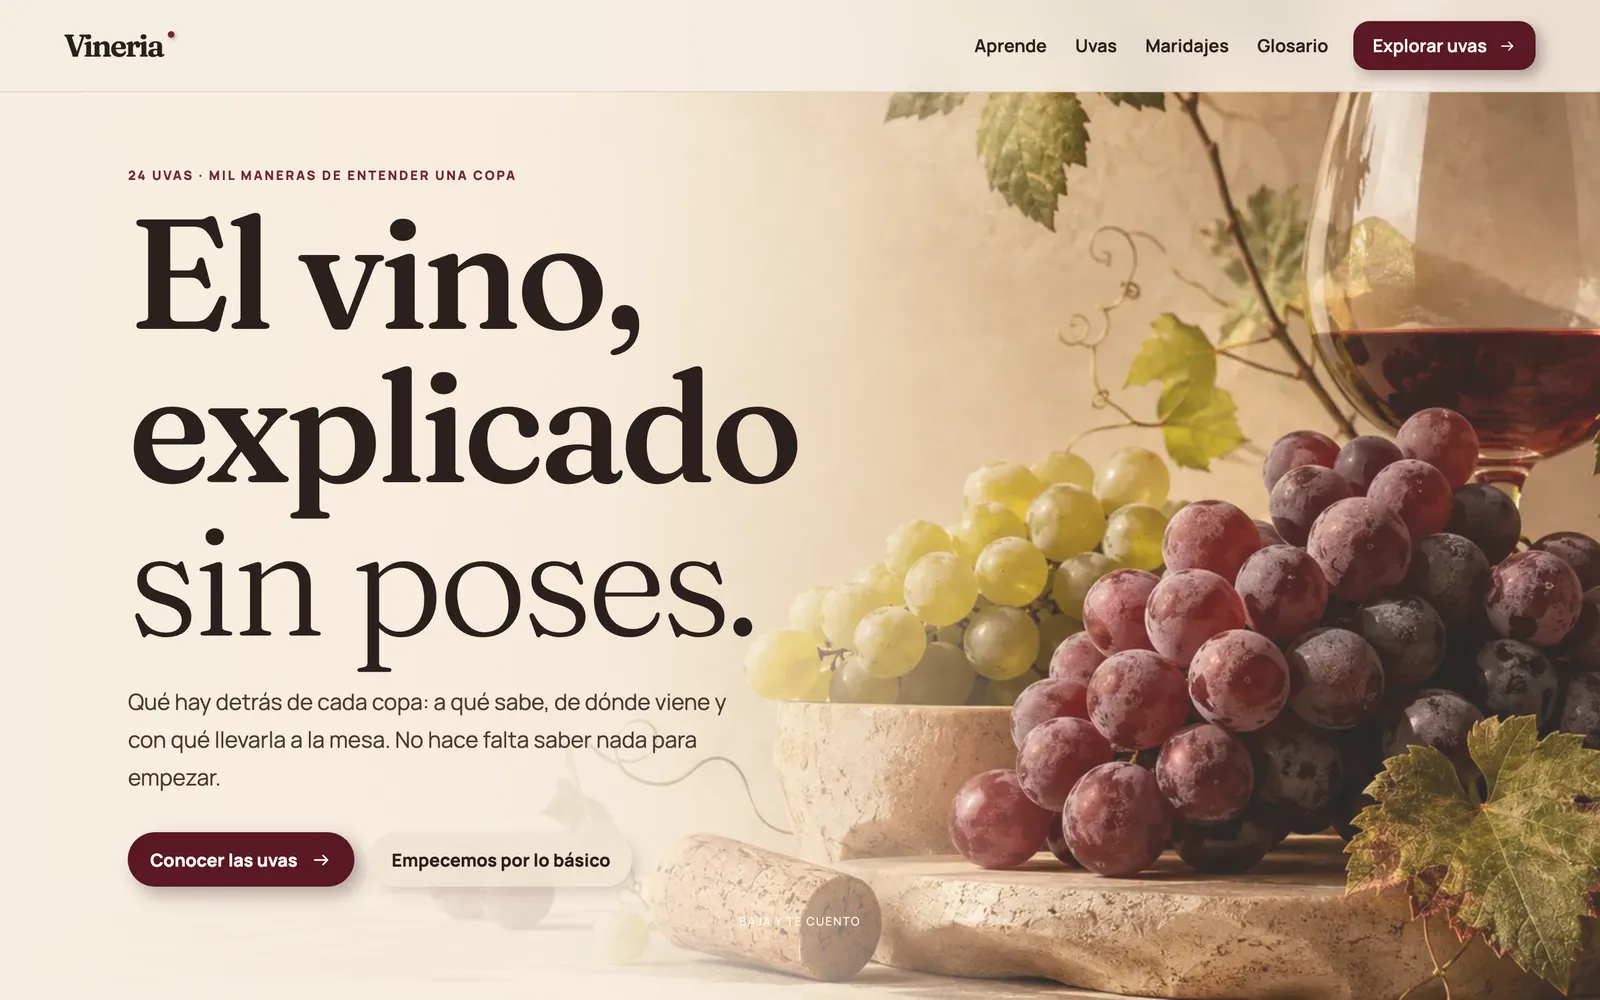 VineríaA guide for choosing wine without knowing about wine. You search, filter by what you like, and each entry tells you more only if you want to keep reading.See the case
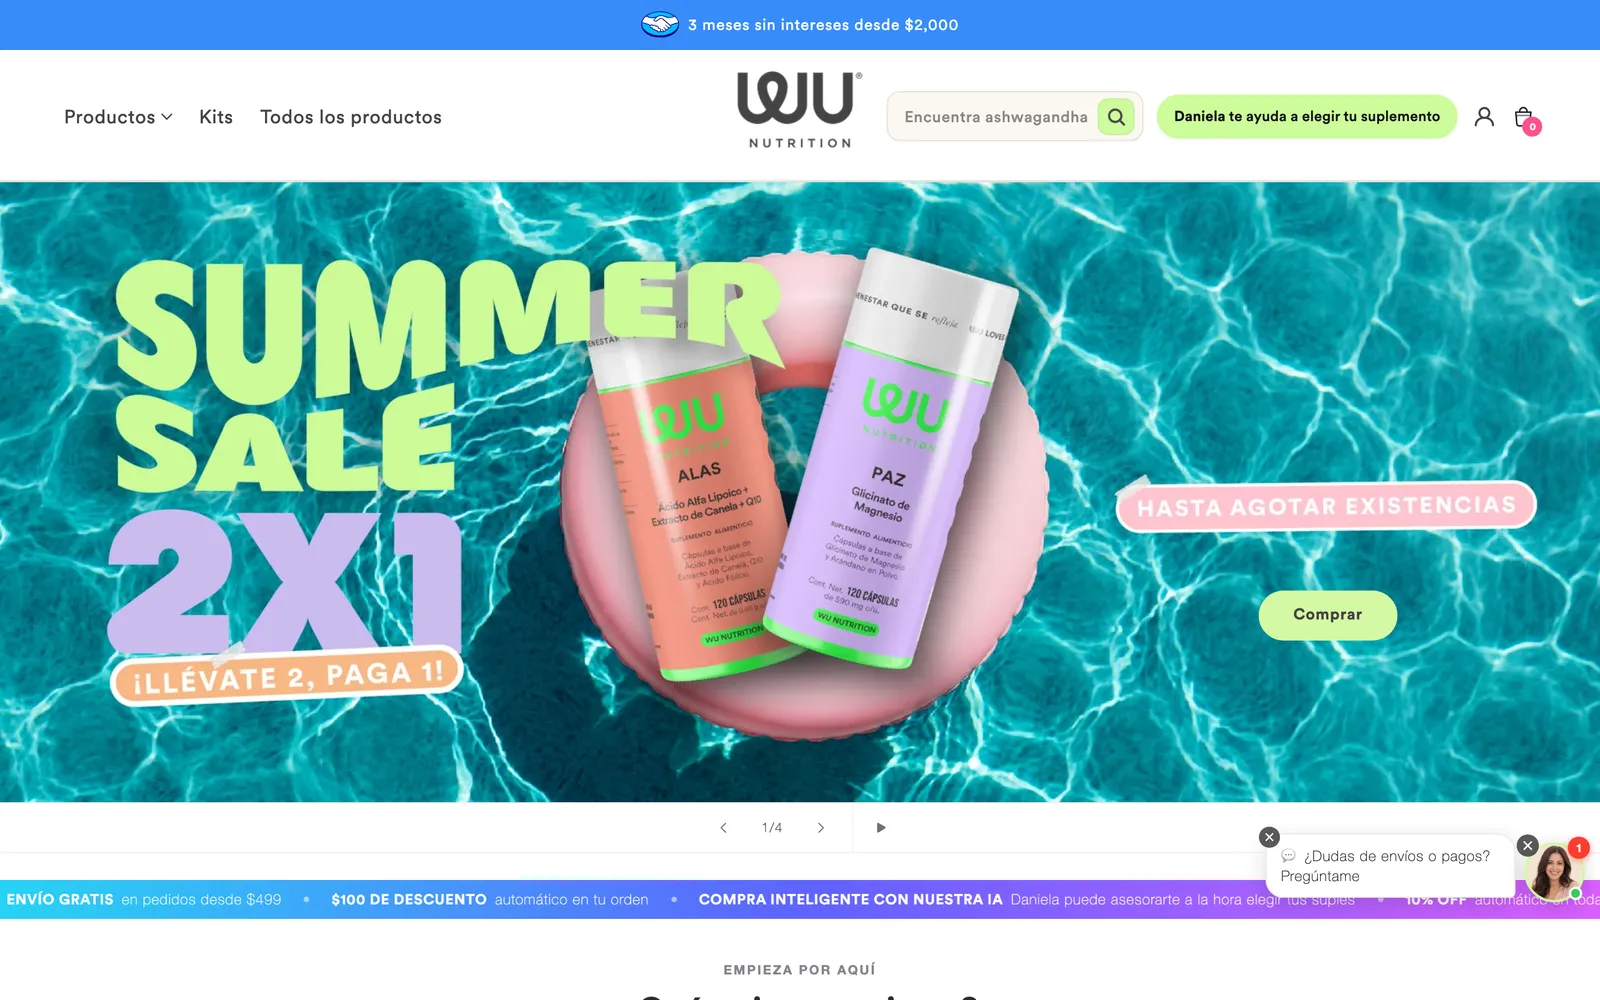 WU NutritionI run online sales for a client, a supplement brand. That includes the store, the advertising that brings visitors, the numbers that show what works, and the AI assistant that helps sell. I set it up so their team can run it without depending on me.See the case
Want something like this for your business?
If you feel your store is losing sales and cannot tell where, that can be found out. I start by walking through it as a customer.